Data Analyst Role: Understanding its Significance and Scope
In today’s digitally driven world, data is the new currency, and those who can effectively harness its power hold a significant advantage. At the heart of this data revolution lies the data analyst role, a profession that has rapidly evolved to become indispensable across various industries.
Whether it’s deciphering customer behavior patterns for targeted marketing campaigns or optimizing supply chain operations for maximum efficiency, data analysts are at the forefront of transforming raw data into actionable insights.
The role of a data analyst is multifaceted, encompassing a range of responsibilities that revolve around extracting insights from data to inform decision-making processes within organizations.
Data analysts are tasked with collecting, organizing, and analyzing data from various sources, including databases, spreadsheets, and software applications.
By applying statistical techniques and data modeling methodologies, they identify trends, patterns, and correlations that offer valuable insights into business performance and consumer behavior.
Beyond data analysis, data analysts often collaborate with cross-functional teams, including business stakeholders, data scientists, and IT professionals, to translate findings into actionable recommendations.
This interdisciplinary nature of the role requires a combination of technical expertise, analytical thinking, and effective communication skills to bridge the gap between raw data and strategic initiatives.
Data Analyst Role: Mastering Essential Data Analysis Skills
Success as a data analyst hinges on a diverse skill set that goes beyond technical proficiency. While expertise in programming languages like Python, R, or SQL is essential for data manipulation and analysis, soft skills such as critical thinking, problem-solving, and attention to detail are equally crucial.
Analytical skills are at the core of a data analyst’s toolkit, enabling them to dissect complex datasets, identify patterns, and derive actionable insights. Whether it’s performing exploratory data analysis to uncover hidden trends or conducting hypothesis testing to validate assumptions, data analysts must possess a keen analytical mindset to extract meaningful conclusions from data.
Effective communication is another essential skill for data analysts, as they often serve as liaisons between technical and non-technical stakeholders. From presenting findings in clear, concise reports to visualizing data in interactive dashboards, data analysts must communicate complex ideas in a way that resonates with diverse audiences.
Educational Background and Certifications
While there is no one-size-fits-all educational path for becoming a data analyst, a strong foundation in quantitative disciplines such as statistics, mathematics, or computer science is advantageous. Many data analysts hold bachelor’s or master’s degrees in related fields, although some may enter the profession through alternative routes such as online courses or boot camps.
In addition to formal education, certifications can help demonstrate proficiency and enhance credibility in the field of data analysis. Certifications such as the Certified Analytics Professional (CAP), offered by the Institute for Operations Research and the Management Sciences (INFORMS), or the Microsoft Certified: Data Analyst Associate certification, validate expertise in key areas of data analysis and can boost career prospects.
Tools and Technologies for Data Analysis
Data analysts leverage a wide array of tools and technologies to perform their duties effectively. From data manipulation and visualization tools to programming languages and statistical software, familiarity with various tools is essential for navigating the data analysis landscape.
One of the most commonly used tools in data analysis is SQL (Structured Query Language), a programming language used for managing and querying relational databases. SQL enables data analysts to extract, manipulate, and analyze data stored in databases, making it a fundamental skill for anyone working with structured data.
In addition to SQL, proficiency in programming languages like Python and R is highly beneficial for data manipulation, statistical analysis, and machine learning tasks. Python, in particular, has emerged as a popular choice among data analysts due to its versatility, ease of use, and extensive library ecosystem for data analysis and visualization.
Data visualization platforms such as Tableau, Power BI, matplotlib, and Seaborn in Python are essential for creating visually compelling representations of data. Effective data visualization not only helps communicate insights more clearly but also enables stakeholders to explore and interact with data in meaningful ways.
Data Visualization Techniques
Data visualization is a powerful tool for transforming raw data into actionable insights. By representing data visually through charts, graphs, and interactive dashboards, data analysts can communicate complex ideas more effectively and facilitate decision-making processes within organizations.
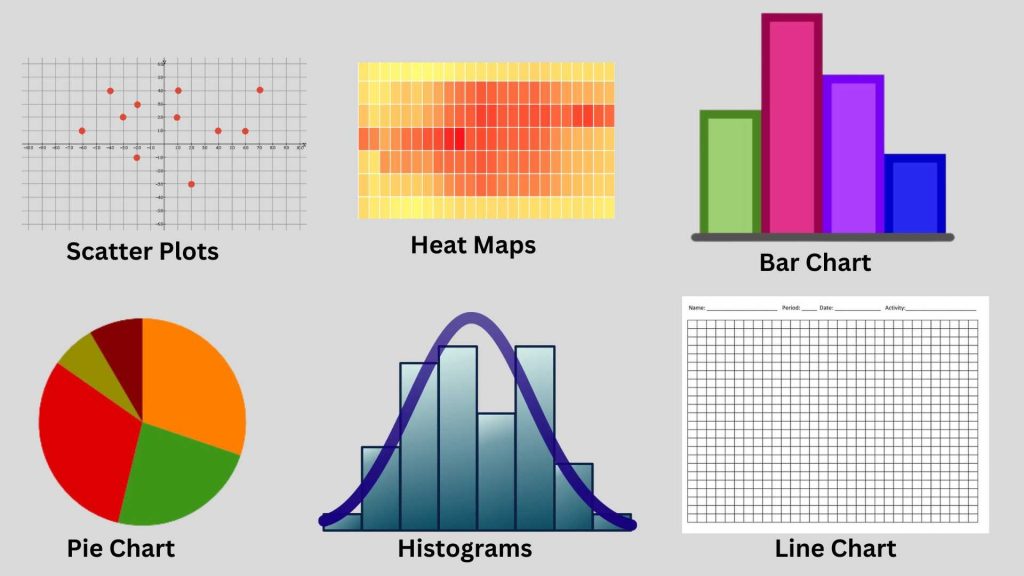
There are various data visualization techniques available to data analysts, each suited to different types of data and analysis goals. Common types of visualizations include:
- Bar Charts and Histograms: Ideal for comparing categories or displaying distributions of numerical data.
- Line Charts: Used to visualize trends over time or relationships between two continuous variables.
- Scatter Plots: Effective for exploring relationships between two numerical variables and identifying patterns or correlations.
- Pie Charts: Suitable for illustrating proportions or percentages within a dataset.
- Heatmaps: Useful for visualizing relationships in a matrix format, such as correlation matrices or geographic data.

In addition to choosing the right type of visualization, data analysts must also consider design principles such as color selection, labeling, and formatting to ensure clarity and effectiveness. By adhering to best practices in data visualization, analysts can create compelling visuals that enhance understanding and drive actionable insights.
Data Cleaning and Preprocessing
Before data analysis can begin, raw data often requires cleaning and preprocessing to ensure accuracy and reliability. Data cleaning involves identifying and rectifying errors, inconsistencies, and missing values within datasets, while data preprocessing involves transforming data into a usable format for analysis.
Common data cleaning techniques include:
- Handling Missing Values: Imputing missing values or removing observations with missing data to maintain dataset integrity.
- Addressing Outliers: Identifying and addressing outliers that may skew analysis results or introduce bias into models.
- Standardizing Data Formats: Converting data into a consistent format (e.g., date formatting, unit conversions) to facilitate analysis.
- Removing Duplicates: Identifying and removing duplicate records to eliminate redundancy and ensure data accuracy.
Data preprocessing steps may include:
- Normalization: Scaling numerical features to a standard range to prevent biases in algorithms that rely on distance metrics.
- One-Hot Encoding: Converting categorical variables into binary vectors to make them compatible with machine learning algorithms.
- Feature Engineering: Creating new features or transforming existing features to improve model performance or capture relevant information.
By investing time and effort in data cleaning and preprocessing, data analysts can ensure the quality and reliability of their analysis results, leading to more accurate insights and informed decision-making.

Statistical Analysis and Modeling
Statistical analysis is a fundamental aspect of data analysis, enabling analysts to uncover patterns, relationships, and trends within datasets. From descriptive statistics to inferential techniques and predictive modeling, data analysts employ a range of statistical methods to extract meaningful insights from data.
Descriptive statistics are used to summarize and describe the characteristics of a dataset, including measures of central tendency (e.g., mean, median, mode) and variability (e.g., standard deviation, range). These summary statistics provide an overview of the distribution of data and help analysts understand its underlying structure.
Inferential statistics, on the other hand, allow analysts to draw conclusions or make predictions about a population based on a sample of data. Techniques such as hypothesis testing, confidence intervals, and regression analysis enable analysts to assess relationships between variables, test hypotheses, and make inferences about the population from which the sample was drawn.
Predictive modeling involves building mathematical models that predict future outcomes or behaviors based on historical data. Machine learning algorithms such as linear regression, decision trees, random forests, and neural networks are commonly used for predictive modeling tasks. These algorithms learn patterns and relationships from historical data and apply them to new, unseen data to make predictions or classifications.
Data analysts use statistical analysis and modeling techniques to answer specific questions or solve particular problems within organizations. Whether it’s predicting customer churn, forecasting sales trends, or optimizing marketing campaigns, statistical analysis and modeling provide valuable insights that inform strategic decision-making processes.
Data Interpretation and Communication
Interpreting data and communicating insights effectively are essential components of the data analyst role. While data analysis uncovers valuable insights, it’s the ability to translate those insights into actionable recommendations that drive meaningful change within organizations.
Data analysts must distill complex findings into clear, concise narratives that resonate with diverse audiences, from C-suite executives to front-line employees. Whether it’s through written reports, presentations, or interactive dashboards, effective communication ensures that insights are understood and acted upon.
Visual storytelling is an increasingly important aspect of data communication, as it enables analysts to convey complex ideas in a visually compelling manner. By combining data visualization techniques with narrative storytelling, analysts can engage stakeholders and facilitate decision-making processes more effectively.
Industry Applications of Data Analysis
Data analysis finds applications across a myriad of industries, from finance and healthcare to marketing and e-commerce. In finance, data analysts use predictive modeling to assess credit risk, detect fraudulent transactions, and optimize investment portfolios. In healthcare, data analysis enables researchers to identify disease trends, track patient outcomes, and personalize treatment plans.
In marketing, data analysts leverage customer segmentation techniques to target specific demographics, analyze campaign performance, and optimize marketing spend. In e-commerce, data analysis powers recommendation engines predicts customer behavior, and optimizes supply chain operations for maximum efficiency.

Career Paths and Opportunities
The field of data analysis offers a multitude of career paths and opportunities for growth. Whether pursuing roles in business intelligence, data science, or consulting, data analysts can carve out fulfilling careers with ample room for advancement and specialization.
Entry-level positions such as data analyst or business analyst provide a solid foundation for aspiring data professionals, allowing them to gain hands-on experience in data analysis, visualization, and interpretation. As they gain experience and expertise, data analysts may progress to roles such as data scientist, data engineer, or analytics manager, where they tackle more complex problems and lead large-scale projects.
Continuous learning and professional development are key to advancing in the field of data analysis. Whether it’s through advanced degrees, certifications, or specialized training programs, ongoing education ensures that data analysts stay abreast of emerging trends and technologies and remain competitive in the job market.
Tips for Aspiring Data Analysts
For those aspiring to enter the field of data analysis, here are some practical tips to help kickstart your career:
- Build a Strong Foundation: Invest in acquiring the necessary technical skills and knowledge through formal education, online courses, or self-study.
- Gain Hands-on Experience: Apply your skills to real-world projects, internships, or freelance opportunities to build a portfolio and demonstrate your abilities to potential employers.
- Network and Collaborate: Engage with professionals in the field through networking events, online communities, or industry conferences. Collaborate with peers on projects to gain insights and exchange ideas.
- Stay Updated: Keep abreast of emerging trends, tools, and technologies in data analysis by attending workshops, webinars, or continuing education programs.
- Hone Your Communication Skills: Practice conveying complex ideas in a clear, concise manner through written reports, presentations, or data visualizations.
- Specialize: Consider specializing in a specific domain or industry, such as healthcare, finance, or marketing, to distinguish yourself and align your skills with market demand.
- Be Curious and Persistent: Approach data analysis with curiosity and a willingness to learn. Be persistent in tackling complex problems and finding creative solutions.
Conclusion
As data continues to proliferate in today’s digital age, the demand for skilled data analysts shows no signs of abating. By mastering essential skills, leveraging cutting-edge tools and technologies, and staying abreast of industry trends, aspiring data analysts can embark on a rewarding career path filled with opportunities for growth and innovation.
Unlock your potential in data science with our comprehensive webinar series. Dive into the essentials of the data analyst role, including vital skills, educational prerequisites, and indispensable tools and technologies. Learn the art of data visualization, the intricacies of cleaning and preprocessing data, and the nuances of statistical analysis and modeling. Explore how to interpret data effectively and communicate your findings with impact across various industries.
Join us in unraveling the myriad career paths and opportunities available in the data science realm. Whether you’re an IT student seeking to align your academic journey with industry demands or a professional looking to upskill, our self-paced program, Trizula Mastery in Data Science, is tailored to equip you with the expertise needed to excel. Don’t miss out on this chance to embark on a journey towards becoming a proficient data analyst. Click the link now to kickstart your transformation into a data science virtuoso.
Data Analyst Role FAQs: Essential Information You Need
1. What programming languages are essential for data analysis?
While proficiency in languages like Python and R is highly beneficial, familiarity with SQL for database querying and manipulation is also essential for data analysis.
2. Are there any prerequisites for pursuing a career in data analysis?
While there are no strict prerequisites, a background in fields such as statistics, mathematics, or computer science can provide a solid foundation for aspiring data analysts.
3. How can I stay updated on the latest trends and technologies in data analysis?
Participating in online communities, attending industry conferences and workshops, and enrolling in continuous learning programs are effective ways to stay abreast of advancements in the field.
4. What career opportunities are available for data analysts?
Data analysts can pursue roles in business intelligence, data science, consulting, and more. Career paths may vary depending on individual interests, skills, and industry preferences.
5. How important is continuous learning in the field of data analysis?
Continuous learning is essential for staying competitive in the rapidly evolving field of data analysis. By staying updated on emerging trends and technologies, data analysts can adapt to changing industry demands and advance their careers effectively.


